On this page
The New GitHub Star History API
GitHub just introduced a privacy-safe API for star history data. Star History adopted it immediately. If a chart broke in the past two months, it should now work again.
The problem with the old stargazer API
star-history.com used the list stargazers endpoint. It returns a starred_at timestamp for each stargazer. Sort the timestamps and you have the curve. It worked, but it had two issues.
Privacy. The endpoint returns each stargazer's username, avatar, and profile URL. Starring a popular repo effectively adds you to a public mailing list. Spammers figured this out long ago. They scrape the list, find public emails on user profiles, and send spam (I am a victim myself).
The page limit. The endpoint returns up to 100 stargazers per page and stops at page 400. It returns nothing beyond 40,000 stars. For larger repos, we could reconstruct the beginning of the curve but not the end. We stitched those charts together from sampled pages and the current star count. Their tails always looked a little too straight.
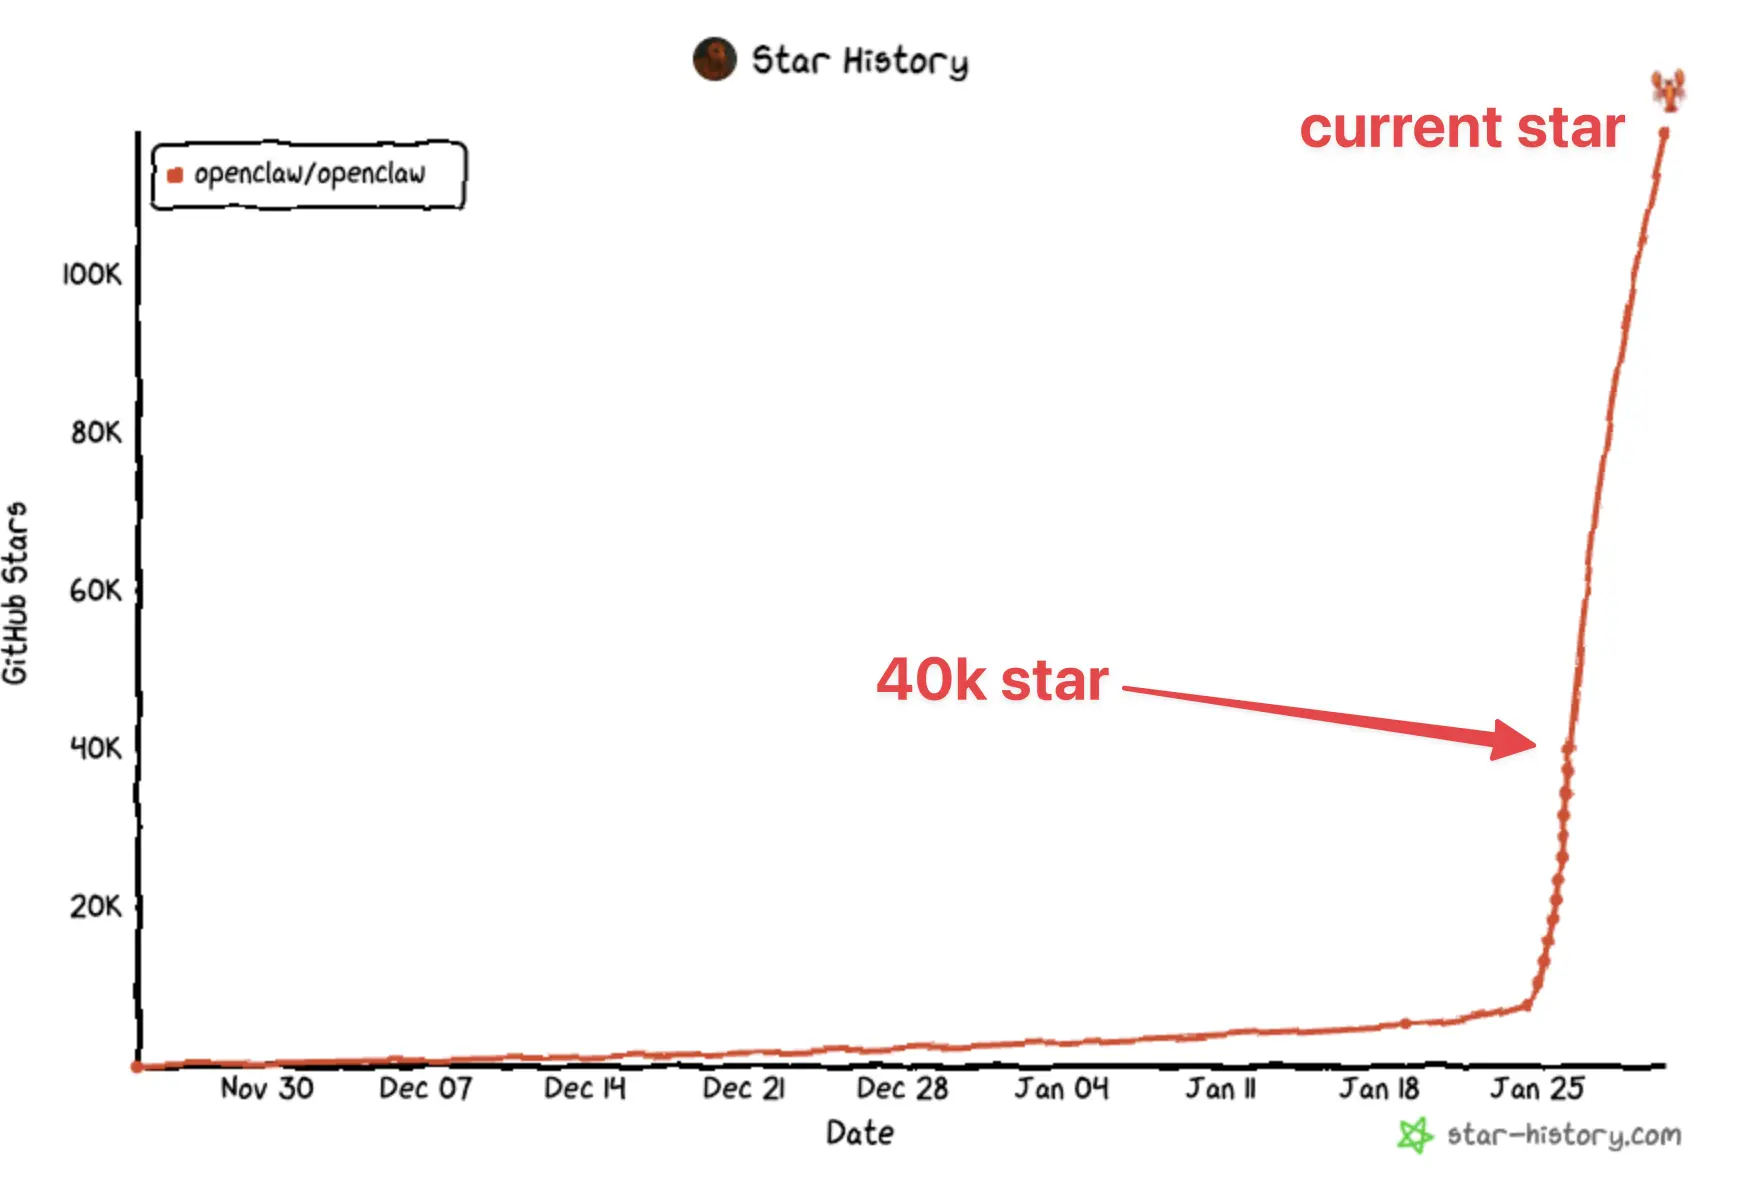
The official tightening
On June 30, GitHub announced access restrictions for public API endpoints and UI views. It limited the stargazers endpoint and the /stargazers page to repository admins and collaborators.
The decision was understandable given the privacy abuse. But it also broke the primary use case of Star History: charting a repo you do not maintain. People use it to evaluate projects, benchmark competitors, or check what just went viral. Earlier this year, Jensen Huang put a Star History chart of OpenClaw on stage during the NVIDIA keynote.
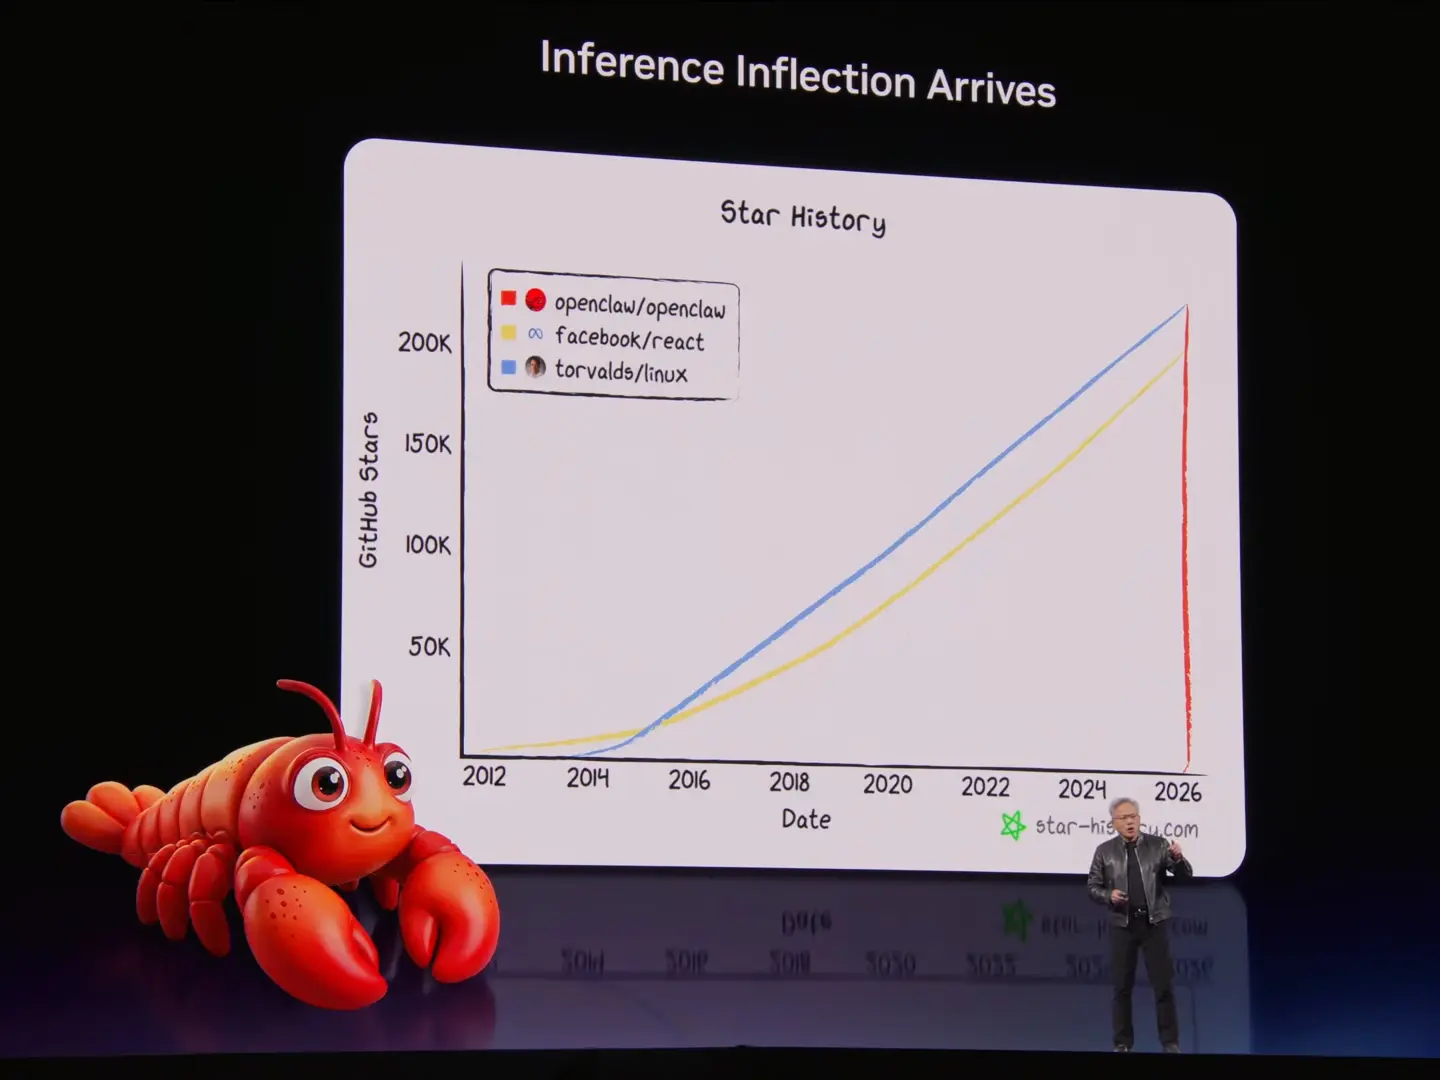
Charts started failing across the site and in READMEs. The community started to grumble. I saw @colinhacks, the creator of Zod, call it out on X. I quoted the post and shared my frustration. Soon after, Ashley (@ashleywolf) from the GitHub Open Source team reached out to me.
The resolution
Ashley connected me with the GitHub engineering team. On a 30-minute call, I explained how star-history.com works and what it needs: star counts over time, with no user data.
About a month later, Ashley introduced me to Camilla (@moraes_c_), who took over the work. I was still fielding reports from frustrated users. The restriction had been an oversight. GitHub did not realize people used the stargazers endpoint this way. The team was already building a dedicated endpoint for star history counts. After another meeting and several rounds of email, I got to test it.
The new API
The endpoint is GET /repos/{owner}/{repo}/stargazers/history. It groups stars by calendar week, with the newest week first. Each entry includes a Unix timestamp for the week's start, the weekly star count, and a days array. The array starts on Sunday. Empty weeks contain zeros, so the pages join into one continuous series.
curl -H "Accept: application/vnd.github+json" \
  "https://api.github.com/repos/star-history/star-history/stargazers/history?per_page=3"
[
  { "week": 1788048000, "total": 19, "days": [2, 1, 4, 4, 4, 3, 1] },
  { "week": 1787443200, "total": 23, "days": [5, 6, 3, 3, 4, 2, 0] },
  { "week": 1786838400, "total": 35, "days": [2, 7, 4, 6, 6, 6, 4] }
]
The response mirrors the existing GET /repos/{owner}/{repo}/stats/commit_activity endpoint. Pagination walks backward to the repository's creation week. Each page contains up to 30 weeks, with a limit of 100 pages. That covers roughly 57 years, so every GitHub repo fits.
There is a companion endpoint, GET /repos/{owner}/{repo}/stargazers/count, that returns the current star count:
{ "count": 9451 }
For Star History, the new API fixes two problems. Any public repo works again, whether or not you maintain it. The 40k limit is also gone.
The response is grouped by week instead of by person. The cost scales with a repo's age, not its popularity. A repo with 300k stars takes the same handful of requests as one with 300. Large repos now show the real curve all the way to the end.
I would still like a cumulative count in each weekly entry. Today, each entry only contains that week's delta. Plotting any point requires fetching every page back to the creation week. A running total would let us sample a few pages and still draw an accurate curve. At our volume, those saved requests add up.
Go check your favorite repo. The chart is back. Large-repo charts are more accurate than ever.